
An interactive web application to understand and act on local air quality forecasts by integrating satellite, ground-based, and weather data. This application provides real-time maps, forecasts, health alerts, and historical trends in a user-friendly command center interface.
- Interactive Map View: Visualize air quality data for different pollutants on a dynamic map. Search for locations and get real-time AQI readings.
- Detailed Forecasts: Get 24-hour and 7-day air quality and weather forecasts for any selected location.
- Customizable Alerts: Set up personalized notifications for specific pollutants and AQI thresholds.
- Historical Trends: Analyze historical air quality data to understand long-term trends and patterns.
- Persona-Based Settings: Tailor the application's experience to your specific role, whether you're a resident, a public health official, or a tourism professional.
- Frontend: React & TypeScript
- Styling: Tailwind CSS
- Mapping: Leaflet
- Charting: Recharts
To run this application, simply open the index.html file in your web browser. All dependencies are loaded via CDNs, and the application is self-contained.
The project is organized into the following main directories and files:
/
├── components/         # Contains all React components (Sidebar, MapView, etc.)
├── App.tsx             # Main application component, handles state and view rendering
├── index.tsx           # Entry point for the React application
├── types.ts            # TypeScript type definitions
├── constants.ts        # Application-wide constants (pollutants, colors, etc.)
├── index.html          # The main HTML file
└── metadata.json       # Project metadata
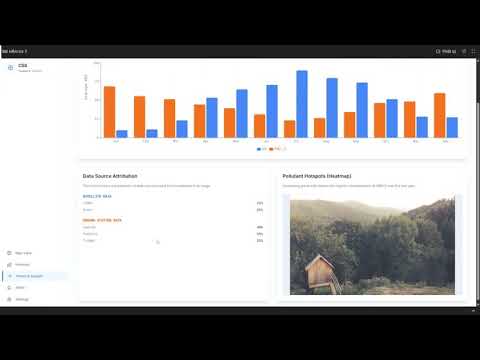
This application currently uses curated mock data to simulate real-world air quality information for demonstration purposes. The data represents a combination of:
- Satellite Data: Simulating feeds from sources like the TEMPO mission.
- Ground Stations: Simulating data from public and private ground-based sensors.